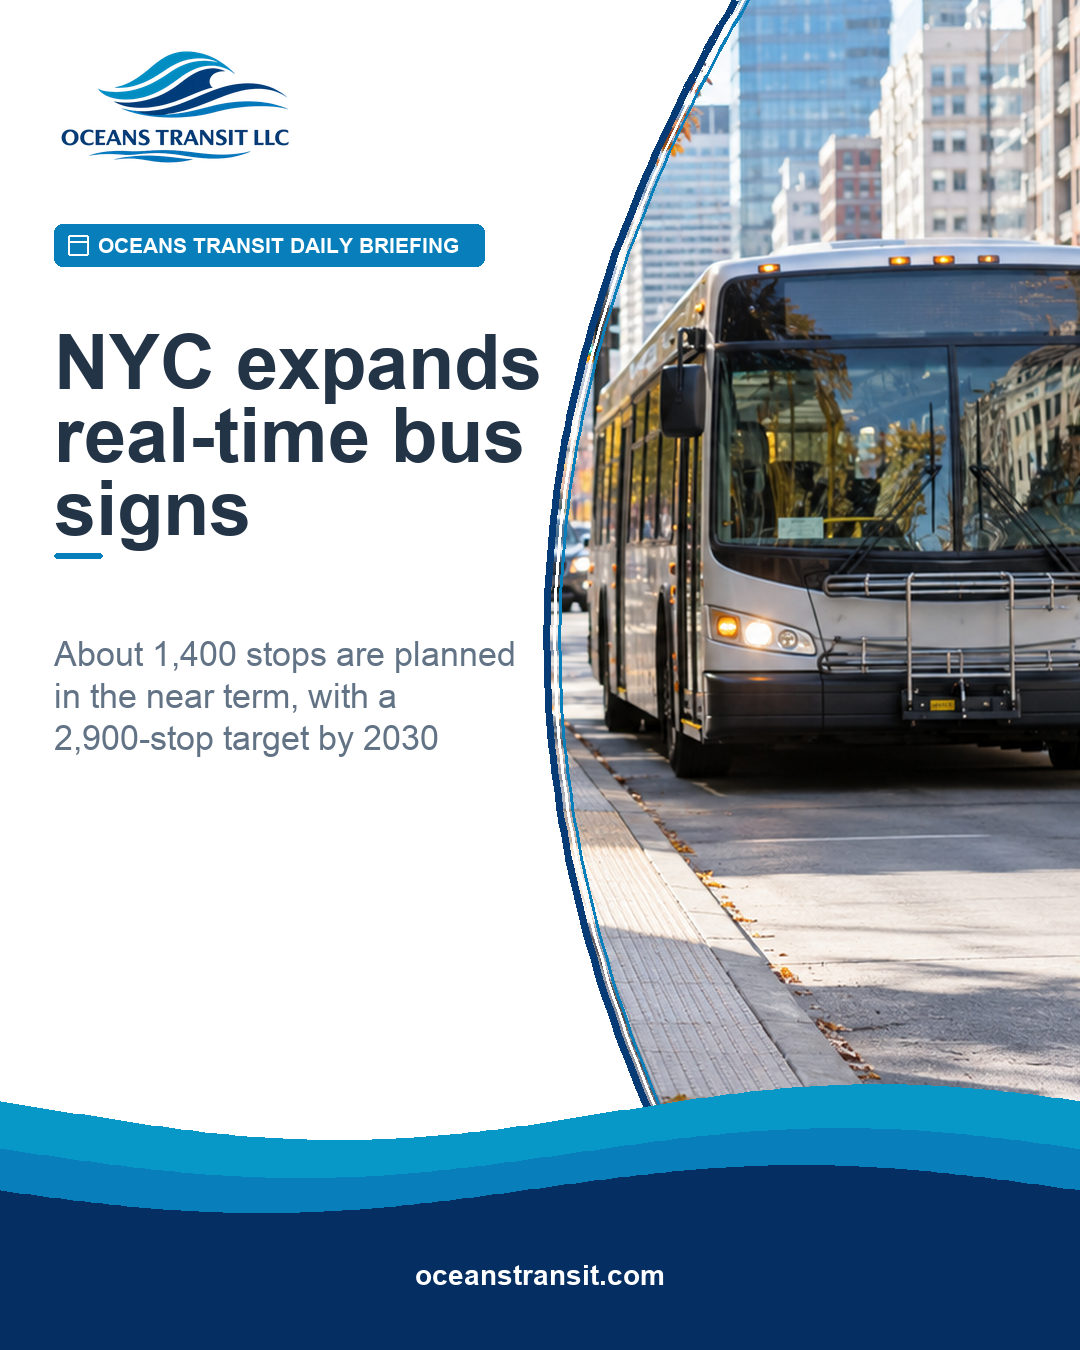
New York City is preparing to double the number of bus stops equipped with real-time arrival information, moving from roughly 700 stops to about 1,400. The city Department of Transportation announced on October 22 that 1,452 digital screens will be installed at bus shelters across all five boroughs, with work beginning this year.
The installation is a practical service improvement, not merely a technology upgrade. A rider who can see the next arrival without opening an app has a better basis for deciding whether to wait, use another route or seek help. That matters for people without reliable mobile data, visitors, older adults, riders with limited digital access and anyone trying to make a transfer under time pressure.
What is being added
NYC DOT says the new screens will be placed at feasible shelters and that stop selection will consider route ridership through an equitable approach. The immediate expansion is distinct from the joint city-state Next Stop plan's larger goal of real-time information at 2,900 stops by 2030. NYC DOT also plans to solicit bids for pole-mounted units.
The numbers require careful reading. A stop can have more than one display, so the clearest service measure is the agency's stated outcome—about 1,400 equipped stops—rather than treating the screen count as the number of locations.
Why operating details matter
Real-time signs only help when vehicle location data, prediction logic, communications, field hardware, power, maintenance and customer-facing language work together. Agencies should define who notices a dark or frozen screen, how quickly a defect is assigned and whether the sign remains legible in glare and at night.
Customer communication during failures belongs in the operating plan. If predictions are unavailable, the display should not present stale information as current. A fallback message coordinated with the agency's other alerts protects trust. Maintenance records should separate damage, power loss, communications faults and data-feed problems so managers can identify the real source of downtime.
Equitable placement is more than distributing dots across a map. Agencies can examine whether selected stops serve riders less likely to use a smartphone, connect to essential destinations, carry high transfer activity or have longer service intervals. Height, contrast, character size, viewing angle and pedestrian clearance should be tested with people who use mobility devices or have low vision.
Rider testing should use realistic tasks in sun, darkness and bad weather and include people who do not routinely use the system. The signs should complement, not replace, accessible digital and audio information.
The Oceans Transit takeaway
Measure the service, not the installation. Track equipped stops, screen uptime, prediction availability, repair time and rider comprehension by borough, route type and neighborhood. The immediate project and the 2030 target are separate promises, and progress should be judged against each—and against whether riders receive information they can actually use.